Žurnāls Ir | Svarīgākais politikā, ekonomikā un kultūrā
Jaunākie raksti

«Es ticu sev!» Elīnas Ievas Botas ceļš līdz olimpiskajam sudrabam
Neatkarīgās Latvijas pirmo olimpisko medaļu individuālajā kamaniņu sportā sievietēm Elīna Ieva Bota (25) izcīnīja ne tikai trasē — izšķirošais darbs notika galvā

Par spīti sāpēm. Olimpiskais medaļnieks Roberts Krūzbergs
Olimpiskās bronzas ieguvējs šorttrekists Roberts Krūzbergs (24) cer, ka viņa vēsturiskais panākums «atvērs acis uz šorttreku Latvijā»

Palielinās mājokļu pabalstus
Skolās atšķiras pamatizglītības kvalitāte
Saeimā izjūk S! frakcija
Lasīt vairāk →Īsi par svarīgāko ik rītu — pieraksties jaunumu vēstulei Ir Svarīgākais!

Pārkāpumi ir! Vainīgo nav? Kokrūpnieku skandāls
Kāpēc neseko disciplinārlietas, ja dienesta izmeklēšana atklājusi nopietnus pārkāpumus kokrūpnieku atbalstā?
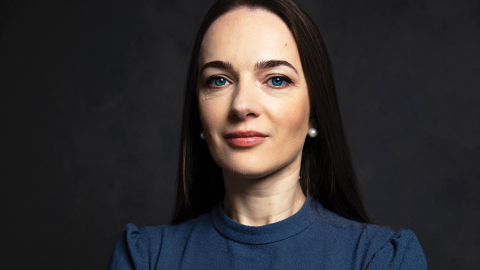
Kā panākt īstu mieru? Nobela miera prēmijas laureāte Oleksandra Matvijčuka
Nobela Miera prēmijas laureāte Oleksandra Matvijčuka par to, kā apstādināt Putina karu

Ukraina uzvarēs
Putins nevar atkāpties, bet iet uz priekšu kļūst aizvien grūtāk
Raidieraksti
Karikatūra
Personības
Viedokļi
Satura mārketings

Carillon Aparthotel – jauns komforta un pilsētas ritma satikšanās punkts Vecrīgā
Vecrīgā durvis ir vērusi Carillon Aparthotel – jauna apartamentu viesnīca, kas piedāvā pārdomātu un ērtu uzturēšanos pašā Rīgas vēsturiskajā centrā. Tās atrašanās vieta netālu no Rīgas Doma baznīcas ļauj viesiem būt notikumu epicentrā, vienlaikus saglabājot mierīgu un privātu vidi, kur atpūsties pēc pilsētas iepazīšanas.Carillon Aparthotel piedāvā 6

ABB eksperts: savlaicīga apkope ir kritiska, lai novērstu dārgas elektroiekārtu dīkstāves
Igaunijas Harju apriņķī izvietotais ABB elektromotoru un ģenerātoru servisa centrs ir lielākais Baltijā un viens no visaugstāk novērtētajiem apkopes pakalpojumu sniedzējiem Ziemeļeiropā. ABB elektriskās piedziņas biznesa vadītājs Latvijā Jānis Senkāns skaidro, ar kādiem defektiem servisa speciālisti saskaras visbiežāk un kāpēc uzņēmumos ir svarīgi veikt savlaicīgu tehnikas apkopi.

Tālie braucieni ar elektroauto - pieredzējušu lietotāju atziņas
Laikā, kad uz ceļiem aizvien vairāk parādās elektroauto, uzlādes infrastruktūra kļūst aizvien plašāka un pieejamāka, tālāki ceļojumi ar elektroauto vairs nav nekāda eksotika. Tādēļ Elektrum Enerģijas centrā notika diskusija “Vai elektroauto ir gatavi tālākiem braucieniem”.
Bizness un ekonomika
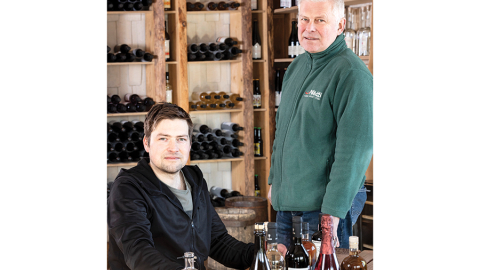
Ābolu gūstītāji – Zilver veiksmes stāsts
Jānis Zilvers ar augļkopību Siguldas pusē sāka nodarboties jau pirms neatkarības, bet dēls Reinis, izstudējis filozofiju, atgriezās ģimenes saimniecībā, lai pievērstos eksotisku vīnu darīšanas mākslai. Biznesā jāsadarbojas ar konkurentiem, viņi apgalvo

Tehnoloģijas stāstu stāstīšanai
Uzņēmums Solavi nodarbojas ar mūsdienīgu audiovizuālu tehnoloģiju uzstādīšanu, producē ekspozīciju iekārtošanu muzejos un tagad radījis savu multimediju šovu Interlude

Kā pieradināt Excel
Darbs ar nebeidzamām skaitļu tabulām rada galvassāpes? Ir risinājums — Latvijā radīta platforma, ko izmēģinājuši jau 300 000 lietotāju no visas pasaules
Pētījumi
Eiropā
Recenzijas
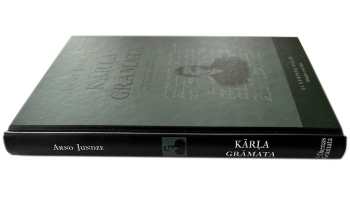
Dzejnieks Veidenbaums. Otrais stāsts
Romāns Kārļa grāmata — aiz katras izcilas personības stāv ģimene

Par lielo un mazo
Dailes teātra izrāde Milzis — vai antisemītiski uzskati ir attaisnojami?

Dzīve kanibāla valstī
Skarbi dokumentāli vēstījumi par Albāniju komunistu tirānijas laikā

Olimpisko spēļu atklāšanas ceremoniju vērtē latviešu režisori
Elmārs Seņkovs, Mārtiņš Eihe un Jānis Znotiņš pārspriež olimpisko spēļu atklāšanas ceremoniju
Populārākie raksti

Dzīvās lelles. Kā modeles no Rīgas tirgoja miljonāriem
Bijušās modeļu aģentūras Vacatio modeles atklāj, kā ar aģentūras starpniecību saņēmušas miljonāru piedāvājumus
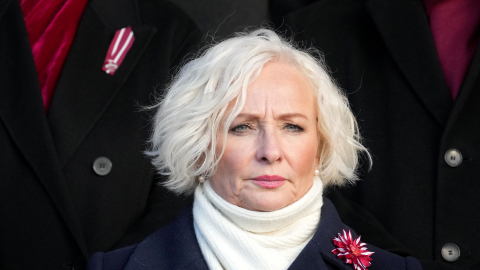
Saeimas priekšsēdētāja aicina piešķirt Miera prēmiju Trampam. Papildināts
Saeimas priekšsēdētāja Daiga Mieriņa (ZZS) parakstījusi vēstuli Nobela prēmijas komitejai, rosinot 2025. gada Miera prēmiju piešķirt ASV prezidentam Donaldam Trampam. Mieriņas komentāri Ir liecina, ka šis solis nav saskaņots ar pārējiem Latvijas ārpolitikas īstenotājiem.

Epstīns un Rīgas «satriecošās meitenes»
Meitenes, paciņas un nauda uz Pļavniekiem. Ko par Rīgu var uzzināt Epstīna failos?

Kā Latvija iepinās skandalozajā filmā «Kremļa burvis»
Šonedēļ Latvijas kinoteātru repertuārā nonāk Rīgā filmētais Kremļa burvis. Šis ļoti dārgais projekts saskārās ar neparedzētiem finansiāliem šķēršļiem un kritiku par to, ka krievu tēli filmā attēloti pārāk pozitīvi

Trampampiņš pret Daili
Šlesera prasība aizliegt teātra izrādi ir pretrunā ar Satversmi


Nav neuzvaramu situāciju! Dziedātāja Atvara
Eirovīzijas dziesmu konkursa kvēlākie fani ārvalstīs par lielajai skatuvei vispiemērotāko dziesmu no Latvijas šogad uzskata Atvaras balādi Ēnā. Viņai gan šajā nedēļas nogalē vēl jāpārvar nacionālās atlases pusfināls

- Komentārs
- 29.01.2026.
- Aivars Ozoliņš
Trampampiņš pret Daili

- Komentārs
- 05.02.2026.
- Aivars Ozoliņš
Atkāpšanās Ogrē



![Ledus [ice]. Māris Bišofs](https://media.ir.lv/media/cache/caricature_index__2xl__jpeg/uploads/media/image/2026021512144569919c9568804.png.jpeg)
