Žurnāls Ir | Svarīgākais politikā, ekonomikā un kultūrā
Jaunākie raksti


Kā Rīgas mērs Viesturs Kleinbergs apdedzinājās, tomēr atgriezās politikā
Jaunais Rīgas mērs Viesturs Kleinbergs (47) pirms vēlēšanām nebija plaši pazīstams, bet tuvākie kolēģi viņu vērtē kā enerģisku «pārmaiņu vadītāju» un cilvēku, kas nepiever acis uz nodokļu naudas izšķērdēšanu
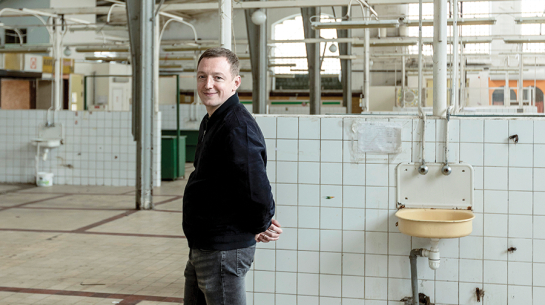
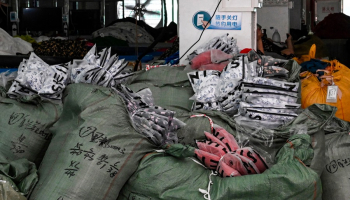
Kāpēc Vidzemes tirgus investoru Ukrainā dēvē par kontrabandas karali
Armēnijas miljonārs Artūrs Grancs grasās atjaunot Vidzemes tirgu, visā kvartālā tuvāko gadu laikā ieguldot 56 miljonus eiro. Tikmēr ukraiņu nevalstiskā organizācija Non-stop dēvē viņu par «kontrabandas karali»
Sāc savu dienu ar uzticamu svarīgāko ziņu apkopojumu!
Īsi par svarīgāko ik rītu — pieraksties jaunumu vēstulei Ir Svarīgākais!


Kā mūzika apvienoja trīs latviešus un trīs ebrejus
«Jau otrajā dziesmā dzied un aplaudē visi» — tā par latviešu un ebreju saprecinātajām melodijām saka grupas Black Rooster Kapelye dalībniece Ilga Vālodze. Grupa, kurā apvienojušies trīs latvieši un trīs ebreji, šonedēļ spēlēs Valmiermuižas etnomūzikas festivālā

Ko paveikuši birokrātijas sloga mazinātāji
Valsts birokrātijas mazinātāji solīja pirmos rezultātus ap Jāņiem. Kas ir izdevies?

Šitake sēņu audzētava barona Firksa bijušajā muižā
Kamēr strādāja algotu darbu, Andris Vjaksa atvaļinājumu vienmēr ņēma sēņu laikā. Tagad viņš sēnes audzē pats. Šitake sēnes
Raidieraksti
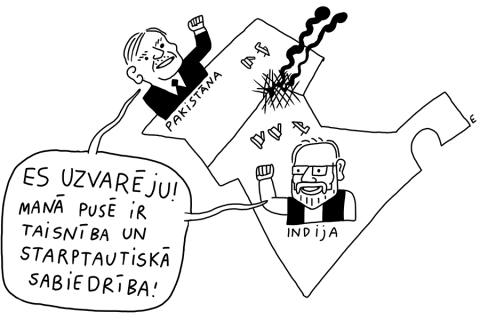
Karikatūra


Personības

Ēriks Kristapsons, bišu spa namiņa īpašnieks
Pirms 10 gadiem inženieris Ēriks Kristapsons ar sievu Ilutu nopirka lauku mājas Bārbeles pusē. Īpašums Iecavas upes krastā, Bārbeles dziednieciskā sēravota tuvumā un meža ielokā bijusi īstā vieta, kur Ēriks sapratis — varēs ne tikai atpūsties no Rīgas burzmas, bet arī turēt bites. Tās Ērikam bijušas mīļas jau kopš bērnības. Pats viņš sevi sauc par mācītu biškopi amatieri, jo savulaik ieguvis biškopja izglītību un gadu praktizējies Dānijā. Ideja par

Ko uz teātra skatuves grib pateikt Matīss Budovskis
Režisora Matīsa Budovska (30) iestudētā izrāde Rītausma Vakaros Liepājas teātrī nominēta Spēlmaņu nakts balvai, bet viņš pats nupat ieguvis maģistra grādu rakstniecībā

Sofija Jansone, atzinība filozofijas olimpiādē
Sajūta, kad priekšā ir balta lapa un ir nepieciešams laiks, lai prāta zobratiņi iegrieztos un rastos pavediens tekstam, Sofijai Jansonei patīk. Maija vidū viņa to piedzīvoja Bari Itālijā, kur notika Starptautiskā filozofijas olimpiāde. Tajā startēja skolēni no 54 valstīm, un starp vairāk nekā 100 dalībniekiem Latviju pārstāvēja ne tikai Rīgas Valsts 2. ģimnāzijas 12. klases skolniece Sofija, bet arī Elza Šlosberga no Jelgavas Spīdolas Valsts ģimnāzijas. Sofijas eseja novērtēta ar atzinību.N
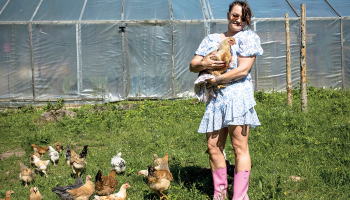
Kā horeogrāfe Līga Liberte bohēmu nomainīja uz dzīvi laukos
Dejotāja un horeogrāfe Līga Liberte stāsta par cīņu ar depresiju un to, kāpēc «Rīgas caca» pārvākusies uz dzīvi laukos

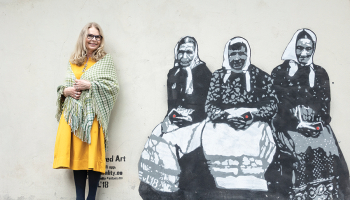
Kas bija pirmās latviešu misionāres Indijā, Ķīnā un Āfrikā
Indija, Tanzānija, Ķīna, Āfrika… Kas bija latviešu misionāres, kuras 19. gadsimtā nesa kristīgo ticību uz tālām zemēm, izpētījusi evaņģēliste Kristīna Ēce
Folkloristes Ilgas Reiznieces padomi skaistai līgošanai
Pirms 20 gadiem mūziķe un folkloriste Ilga Reizniece (69) sāka nebijušu akciju visā Latvijā — astoņus gadus ik jūniju mācīja skaisti līgot un piedzīvot Jāņus ar rituāliem. Kādus viņa šodien redz mūs — savus izskolotos jāņabērnus?
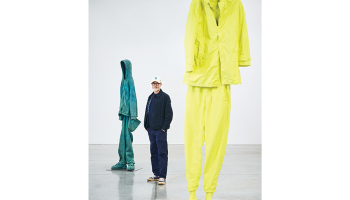
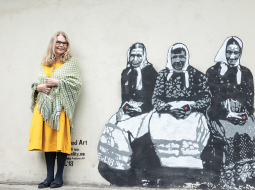
Austriešu mākslinieks Vurms: pasaulē ir daudz idiotu, kas grib visu iznīcināt
Pasaulē pazīstamais austriešu mākslinieks Ervīns Vurms uzskata, ka māksla ir svarīga cilvēces attīstībai. Viņa personālizstāde Kā tas ir patlaban skatāma mākslas centrā Zuzeum Rīgā
Diriģents Tarmo Peltokoski: es dievinu Rīgu!
Latvijas Nacionālā simfoniskā orķestra mākslinieciskais vadītājs Tarmo Peltokoski (25) dosies prom, bet Rīga viņam vienmēr būs ļoti īpaša pilsēta
Viedokļi
Recenzijas

Barselonas sesijas
Prāta vētras jaunais albums sākas emocionāli daudzslāņaini un muzikāli pašpietiekami, bet tad sāk zaudēt fokusu


Pētījumi

Kāpēc joprojām pieaug bojāgājušo motociklistu skaits
Satiksmes negadījumos iet bojā aizvien vairāk motociklistu. Ko darīt, lai uzlabotu viņu drošību?
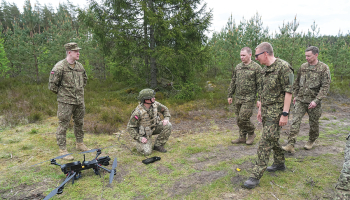
Kā dronu revolūcija izmaina Latvijas aizsardzību
Kā pirmajā darba gadā Dronu koalīcijai veicies ar Ukrainas frontes apgādi? Un cik ambiciozi ir mūsu armijas plāni šo tehnoloģiju ieviešanai Latvijas aizsardzībā?

Šlesers nebūs mērs, bet kādas ir Kleinberga izredzes?
Aināra Šlesera plāns pārņemt Rīgu ir izgāzies. Balsu vairākums domē ir četru eiropeisko partiju koalīcijai, ko sācis veidot Progresīvo līderis Viesturs Kleinbergs. Vai viņš būs nākamais mērs?
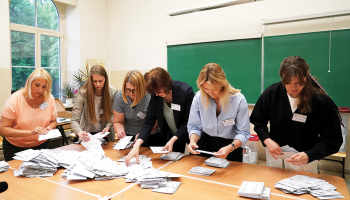
Kas nogāja greizi vēlēšanu naktī?
CVK vadītāja atklāj, ka dienu pirms vēlēšanām bijusi gatava paziņot — elektroniskā sistēma nav gatava. Kas nogāja greizi?

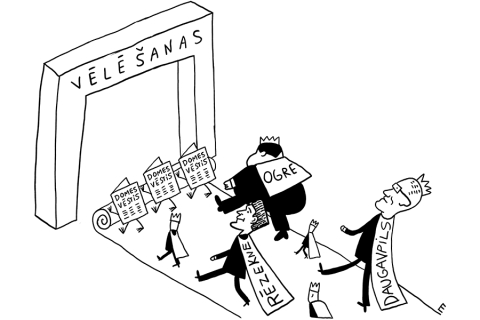
Ko esam sabalsojuši?
Rīgā spriedze līdz pēdējam brīdim, Latgales vadoņi triumfē, daudzviet ilggadējo mēru šarms izbalē — Ir aplūko interesantākos pašvaldību vēlēšanu rezultātus

Kā valdība nekontrolēja airBaltic dārgos attīstības plānus
Valsts kontroles ziņojums ļauj izsekot, kad valsts atteicās atgūt kovida laikā airBaltic ieguldītos miljonus un cik absurds bijis uzraudzības trūkums
Prokurore: Stukānam vajadzēja vēl vienu apsūdzēto
Ģenerālprokurors Juris Stukāns rīkojies neētiski, bet tas nav pamats viņa atlaišanai, pārbaudē secinājuši Augstākās tiesas senatori. Prokurores Viorikas Jirgenas stāstītais gan atklāj uztraucošu ainu Ģenerālprokuratūrā

Kurš vadīs Rīgu?
Visticamāk, kāds no šiem partiju līderiem. Jaunākie reitingi cerības pārvarēt 5% barjeru dod septiņiem sarakstiem, vēl trīs pēdējie spējuši savākt vismaz 2% balsu. Ir piedāvā īsu pārskatu par viņu galvenajiem solījumiem
Eiropā
VIDEO: Ko Eiropa var darīt saistībā ar “Shein” un “Temu”?
Eiropas Savienība cenšas apturēt Ķīnas e-komercijas platformu popularitātes pieaugumu.
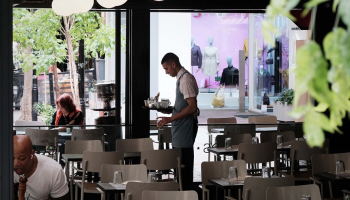
VIDEO: Smags darbs saulē - Grieķijas jaunie sezonas strādnieki
Darba līgumi ar noteiktu termiņu, sezonas darbs, nepilna laika darbs. Daudziem sezonas darbiniekiem Grieķijā situācija ir nestabila.

VIDEO: Sociālie mediji un bērni - aizliegt vai aizsargāt?
Vairākas ES valstis vēlas, lai sociālie mediji tiktu pilnībā bloķēti lietotājiem, kas jaunāki par 15 gadiem.

VIDEO: Vai Eiropa maina savu nostāju pret Izraēlu?
Tirdzniecība, ieroči, banku konti... Ņemot vērā notikumus Gazā, tiek apspriestas dažādas sankcijas.
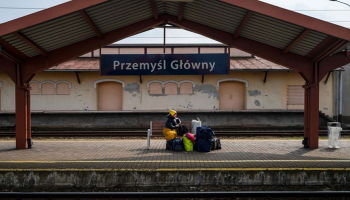
VIDEO: Ukrainas bēgļi Eiropā
Aptuveni puse no ukraiņiem, kuri ir aizbēguši no savas dzimtenes, dzīvo Vācijā un Polijā.

VIDEO: Dīzeļgeitas nāvējošās izmaksas
Pa Eiropas Savienības ceļiem joprojām brauc miljoniem automašīnu, kas rada milzīgu piesārņojumu, un Eiropas iedzīvotāji aizvien iet bojā.

VIDEO: Vai Eiropā atgriežas kodolenerģija?
Vairākas Eiropas Savienības valstis pārskata savu nostāju attiecībā uz kodolenerģiju.

VIDEO: Vai ES var apturēt Krievijas ēnu floti?
Simtiem spoku kuģu baro Krievijas kara ekonomiku. ES pastiprina sankcijas, lai mēģinātu tos apturēt.
Bizness un ekonomika
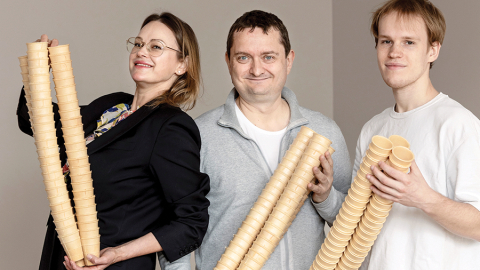
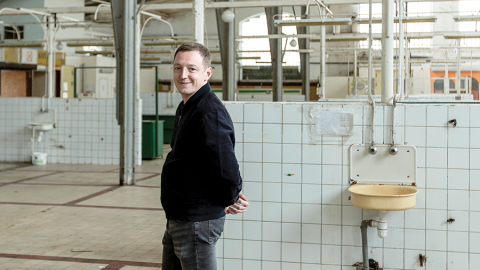
Miljoni vafeļu
Pirms daudziem gadiem mamma Viktoram Ratkevičam solījusi: «Mūsu ģimene reiz būvēs rūpnīcas!» Tagad viņš ir vafeļu ražošanas uzņēmuma Vafelīte valdes priekšsēdētājs, un izaugsme esot tik strauja kā vēl nekad
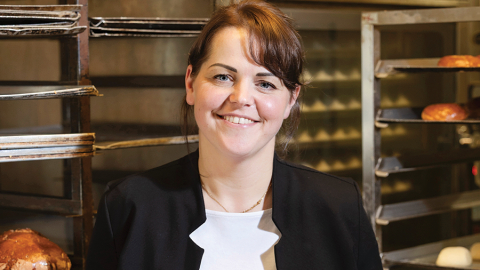
Saulkrastu superpīrāgi
Saulkrastu uzņēmuma Superpīrāgs īpašniece Ilze Kalviša savu biznesu savulaik sāka, bruņojusies ar pavārgrāmatu un paļāvību, bez mazākās pieredzes konditorejā un visu nepieciešamo aizņemoties

Pāļu injekcijas pamatiem
Mikropāļi ir samērā jauna būvniecības tehnoloģija, kuru Latvijā un Igaunijā jau 25 gadus attīsta Daiņa Mūsiņa uzņēmums. Savulaik četri gadi nostrādāti arī Apvienotajos Arābu Emirātos, bet tagad tuvākais mērķis ir iespiesties Lietuvas tirgū

Populārākie raksti

Kādas ir Šlesera biznesa intereses Rīgā
Kādas ir mēra kandidāta Aināra Šlesera biznesa intereses Rīgā? Viņa ģimenei galvaspilsētā pieder prāvas platības Andrejsalā un Skanstē, bet ostas biznesi kara sankciju dēļ ir iestrēguši
Kāpēc Vidzemes tirgus investoru Ukrainā dēvē par kontrabandas karali
Armēnijas miljonārs Artūrs Grancs grasās atjaunot Vidzemes tirgu, visā kvartālā tuvāko gadu laikā ieguldot 56 miljonus eiro. Tikmēr ukraiņu nevalstiskā organizācija Non-stop dēvē viņu par «kontrabandas karali»

Kurš vadīs Rīgu?
Visticamāk, kāds no šiem partiju līderiem. Jaunākie reitingi cerības pārvarēt 5% barjeru dod septiņiem sarakstiem, vēl trīs pēdējie spējuši savākt vismaz 2% balsu. Ir piedāvā īsu pārskatu par viņu galvenajiem solījumiem

- Analīze
- 03.07.2025.
- Ieva Jakone
Kāpēc Vidzemes tirgus investoru Ukrainā dēvē par kontrabandas karali

- Analīze
- 05.06.2025.
Kurš vadīs Rīgu?

Prokurore: Stukānam vajadzēja vēl vienu apsūdzēto
Ģenerālprokurors Juris Stukāns rīkojies neētiski, bet tas nav pamats viņa atlaišanai, pārbaudē secinājuši Augstākās tiesas senatori. Prokurores Viorikas Jirgenas stāstītais gan atklāj uztraucošu ainu Ģenerālprokuratūrā
Šlesers nebūs mērs, bet kādas ir Kleinberga izredzes?
Aināra Šlesera plāns pārņemt Rīgu ir izgāzies. Balsu vairākums domē ir četru eiropeisko partiju koalīcijai, ko sācis veidot Progresīvo līderis Viesturs Kleinbergs. Vai viņš būs nākamais mērs?

Oligarhu atlaidējs Valdis Zatlers par bailīgajiem politiķiem un mūsu drošību
Eksprezidents Valdis Zatlers aicina uzņemties atbildību un doties balsot, lai gan atzīst — pats vēl gaida kādu pēdējā brīža skandālu, kas palīdzēs izdarīt izvēli
Folkloristes Ilgas Reiznieces padomi skaistai līgošanai
Pirms 20 gadiem mūziķe un folkloriste Ilga Reizniece (69) sāka nebijušu akciju visā Latvijā — astoņus gadus ik jūniju mācīja skaisti līgot un piedzīvot Jāņus ar rituāliem. Kādus viņa šodien redz mūs — savus izskolotos jāņabērnus?