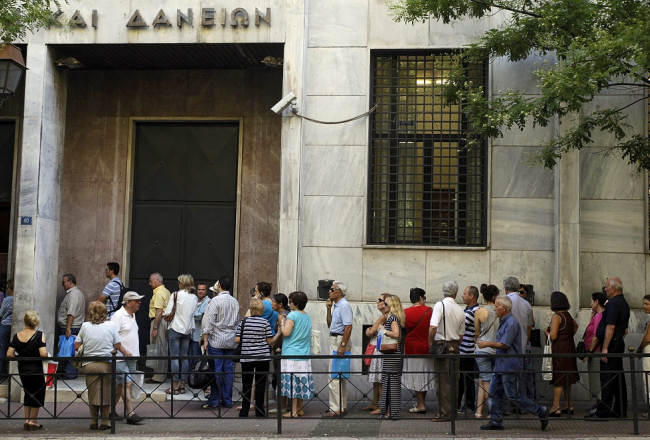
Cilvēki stāv rindā pie bankas Atēnās, lai tukšotu savus depozītus. Foto: EPA/LETA
This column is the third part of a series of three with ten observations on the Latvian and Greek economies to determine similarities and differences and to see who - if any - can learn from whom.
Part I is here, part II is here.
Once again I allow myself to continue numbering from the first and second part; this makes it easier to refer to previous graphs if necessary.
This part is for a few reflections on the open economies of Greece and Latvia and some looking ahead.
9) When the Latvian economy came out of the doldrums in 2010 it was due to a sharp increase in exports (see Figure 12, later) due to increased demand from trading partners but also increased competitiveness vis-à-vis trading partners. This is seen in Figure 11 as a drop in the Real Effective Exchange Rate (REER), meaning costs and prices falling faster in Latvia or not rising so fast as in trading partner countries. Latvia lost competitiveness during the boom times but regained a considerable amount afterwards (the "internal devaluation"). For comparison I have added, as a benchmark, Germany, that super-competitive economy, to the graph. What we have is that Greece has by now a slower cost development than Germany when compared to 2002, which should mean much-earned competitiveness - internal devaluation works in Greece and not surprisingly so: With 28% unemployment there is no upwards push on labour costs, quite the contrary. But has this helped Greek exports, as the increased Latvian competitiveness after 2008-09 helped Latvian exports and the Latvian economy? Turn to Figure 12.