GDP time travel • IR.lv

GDP time travel

Ilustratīvs attēls no pixabay.com
Mortens Hansens, ekonomists

Corona has taken its toll on the economy – big time – and while we may be crawling out from a hole and seeing some improvement again, we should feel blessed about being where we are. Many alternatives look a lot worse.

Here just a couple of graphs for the sake of comparison in the EU and to highlight how deep the current recession has been in some places.

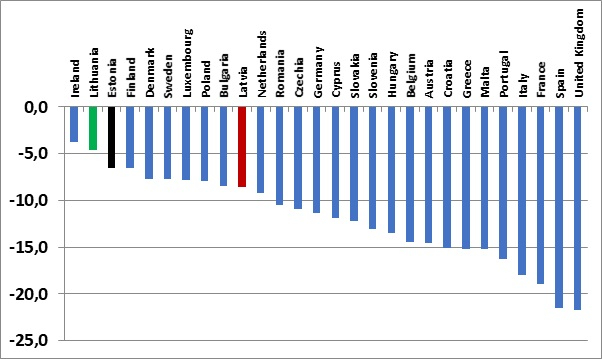
Data from the second quarter of 2020 is available and it shows a grim picture. Obviously, GDP fell in all EU countries compared to the 2nd quarter of 2019 but at very different rates, see Figure 1.

Figure 1: Growth (decline…) of GDP in constant prices, 2nd quarter 2020 over 2nd quarter 2019.

Source: Eurostat and own calculations

Hardest hit were the southern European economies that rely heavily on tourism, as well as the United Kingdom. Corona and Brexit seem to be a particularly toxic cocktail.
Already before corona/Covid-19 the growing divide between North and South in the EU was of concern; the current pandemic has exacerbated this via its asymmetric impact.

But one may illustrate the impact in a slightly different way, which is, however, quite illuminating. So, as an example, Latvian GDP saw a decline of 8.6% from Q2 2019 to Q2 2020. Looking at the data, one will see that this puts Latvian GDP at the level it had around Q4 2016 or, in other words, the economy has been bombed back to the end of 2016 in terms of size, a GDP time travel of 3 ½ years or 14 quarters. Big setback? Not when compared to the rest of the EU. In Figure 2 I portray how far back in time* the 27 EU economies (plus the UK; sentimental reasons on my part) have been sent due to corona. It is quite dramatic.

Figure 2: Number of quarters back in time since an economy had the size it did in Q2 2020

Source: Eurostat and IMF and own calculations

As can be seen, in this way Latvia is one of the least affected countries – but again with the two other Baltic countries doing better. The UK in Q2 2020 was on par with Q2 2003 – an astonishing 17 years or 68 quarters in the past.

For Italy the time series in Eurostat was not long enough to find out last time the country had as low a GDP as in Q2 2020 so I had to look at IMF data and found the answer to be around 1990 or some 120 quarters in the past. By size, Italy’s economy is back to where it was before Latvia became independent! – or, if you want another number for comparison, you have to go no less than 16 Italian Prime Ministers back in time to find 1990.

Which makes me think – although there will be significant growth next year and growth that has perhaps already started again; with such massive declines it is hard to see how we should “just” have a swift V-shaped recovery back to where we were. There must be some permanent damage out there and in particular in the South.

In short, the pandemic has been very tough here and abysmally so on some sectors – but it could have been a lot worse…


Morten Hansen is Head of Economics Department at Stockholm School of Economics in Riga and Vice-Chairman of the Fiscal Discipline Council of Latvia.

* Many thanks to DG for inspiration here.

Pagaidām nav neviena komentāra

Saņem svarīgākās ziņas katru darba dienas rītu