This column is the second part of a series of three with ten observations on the Latvian and Greek economies to determine similarities and differences and to see who – if any – can learn from whom.
The first part is available here. This part mainly discusses fiscal issues and I allow myself to continue numbering from the first part; this makes it easier to refer to previous graphs if necessary.
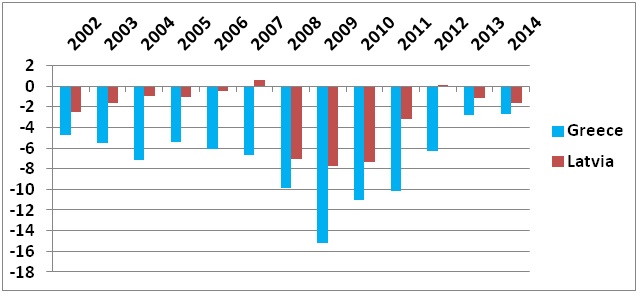
4) Greece is by many accused of fiscal incontinence and that is also true, see Figure 6, which displays actual budget balances as a share of GDP. Even in decent times before the financial crisis Greece ran substantial budget deficits and the 2014 deficit of 2.7% of GDP is the lowest deficit since 1980(!). The seemingly good budget balances for Latvia in the run-up to the financial crisis masks the fact that the economy was overheating and that tax revenues were thus unsustainably high – but nevertheless were spent, i.e. also reckless fiscal policy (see e.g. a previous article on this topic here). This makes it worthwhile to look at the structural budget balance, see Figure 7.
Figure 6: Actual budget balance as a share of GDP, Greece and Latvia, 2002 – 2014
Source: IMF
5) The structural budget balance shows what the budget balance would look like in case the economy had been at full employment. Unfortunately, data estimates for Latvia only start in 2007. In 2007 Latvia had a small actual budget surplus (Figure 6) but it was nevertheless a structural deficit (Figure7), reflecting, as mentioned above that the economy was overheating and that the actual budget surplus only came about due to unsustainable windfall tax revenues. If we trust the numbers we get that Latvia had much smaller structural deficits (= more prudent (but still not entirely prudent) fiscal policy) than Greece. We also get that Latvia fairly quickly reduced these structural deficits – via the much-maligned austerity measures – whereas this took considerably more time in Greece. But it is also important to notice that Greece has, contrary to what many believe, turned its fiscal policy around and was in 2013 reporting a structural surplus; a quite Herculean effort and via massive austerity. There was still an actual budget deficit (Figure 6) but this is of course due to the very high unemployment (Figure 3, previous article) which results in much less tax revenue than if the economy had been at full employment.
Figure 7: Structural budget balance, Greece and Latvia, 2002 – 2013
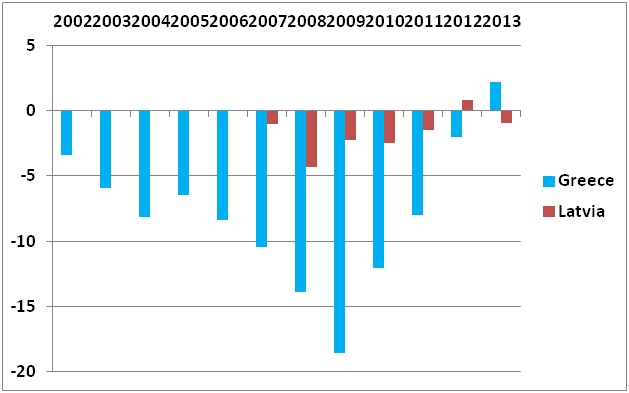
Source: IMF Note: These are estimates since the economies were not at full employment. Personally, I would think that the structural deficit in 2007 was substantially larger since the economy was wildly overheating at that time.
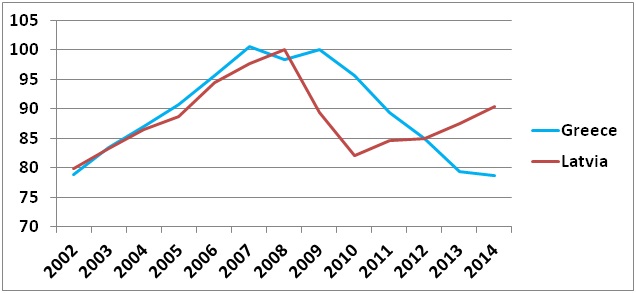
6) But how much austerity have the Greeks introduced? Latvia is sometimes seen as a sort of #1 in terms of austerity but how does it compare to Greece? Here the evidence (at least what I have) gets a bit murky. In terms of government consumption (thus excluding redistribution such as pensions, unemployment benefits etc.) both countries have slashed spending sharply, see Figure 8. This says that by now Greece has made somewhat deeper cuts than Latvia but that Latvia slashed spending much more quickly (“front-loaded austerity”). This is also confirmed in this tweet by Simon Tilford of the Centre for European Reform. Latvia may thus not be the “austerity champion” – and who wants to be anyway? – in terms of total cuts in spending but it should retain its position in terms of “austerity intensity” if we define that as total spending cuts divided by the number of years of austerity – in Latvia maximum three years, in Greece still ongoing.
Figure 8: Government spending in real terms. Index = 100 for year of maximum (2008 for Latvia, 2009 for Greece)
Source: Eurostat and own calculations
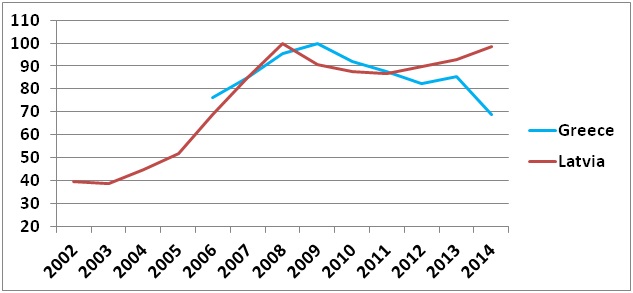
In terms of total government expenditure (consumption and transfers such as pensions etc.) I get the following picture (Figure 9). This shows, if true, considerably more austerity in Greece with expenditure now less than 70% of its value at its peak in real terms. I am somewhat skeptical of these numbers (I have deflated with the Consumer Price Index, which may not be the optimal in this case) but at least this also shows that the austerity effort happened faster in Latvia.
Figure 9: Government expenditure in real terms (deflator: CPI). Index = 100 for year of maximum (2008 for Latvia, 2009 for Greece)
Source: Eurostat and own calculations
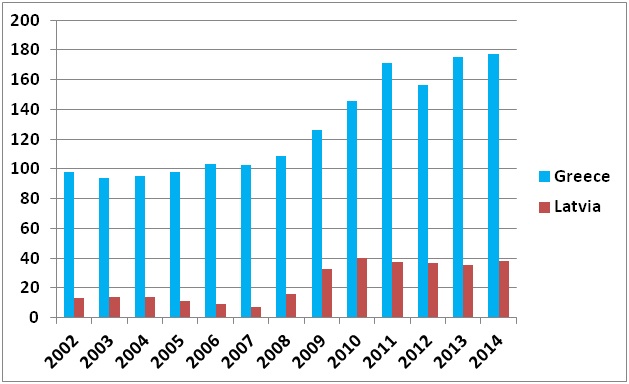
7) The reasons for austerity measures were to get government budgets as well as government debt under control. The former has been accomplished (Figure 7) in both countries but the latter has not with debt stabilizing in Latvia but soaring in Greece, see Figure 10. Also here, the speed of adjustment has made a difference – the short period of recession with high budget deficits in 2008, 2009 and 2010 increased debt and decreased GDP, thus sharply worsening the debt-to-GDP ratio but with quickly implemented spending cuts the budget was under control by 2011 and with renewed economic growth the debt ratio stabilized/started to decline a bit. Much slower adjustment in Greece paired with continuing recession kept adding to debt while at the same time reducing GDP (the 2012 decline is the debt ratio is due to write-offs as part of Greece’s 2nd bailout).
The initial size of debt should also be taken into consideration. Greece’s was high at close to 100% of GDP in the early 2000s and quickly rose to unsustainable levels during the crisis. Latvia’s debt quadrupled but from an ultra-low level to a very moderate level (Latvia’s debt-to-GDP ratio is similar to Sweden’s and Denmark’s and nobody considers their government debts unsustainable).
Figure 10: Government gross debt as a share of GDP, Greece and Latvia, 2002 – 2014
Source: IMF
8) Yet another difference between the two countries is the size of assistance. Lending to Latvia in 2008 from the EU, IMF, EBRD, World Bank and various countries was 35% of Latvian GDP at that time to support the budget, the banking system (notably Parex) and the exchange rate and was more than enough and Latvia exited from the assistance programme in June 2012. Greece has seen two bailouts, in 2010 of 110 bill. EUR (some 49% of Greek GDP that year) and in 2012 of 130 bill. EUR (67% of GDP) and a third package is on its way. This speaks of that, yes, Latvia had severe problems but they are dwarfed by the economic problems in Greece – we have two very different cases here.
Conclusions, part II
a) Greece pursued reckless fiscal policy in the build-up to the crisis and so did Latvia but to a lesser extent.
b) Both countries have imposed austerity – Greece the most but Latvia with the highest “intensity” with quite fast implemented, very severely front-loaded austerity.
c) If austerity is really needed, front-loaded austerity seems the best choice.
d) Latvia can learn from Greece – do not let government debt rise to high levels in the first place.
e) The two countries are very different in terms of the severity of their economic problems – with much deeper problems in Greece.
Part III of this comparison will have some additional numbers of relevance such as the current count and competitiveness.
Note: The points of view expressed here on fiscal policy issues may not necessarily be those of the Fiscal Discipline Council.
Morten Hansen is Head of Economics Department at Stockholm School of Economics in Riga and a member of the Fiscal Discipline Council of Latvia


Komentāri (40)
MZGD 24.07.2015. 15.34
Fig. 7 begs for better labels.
0